
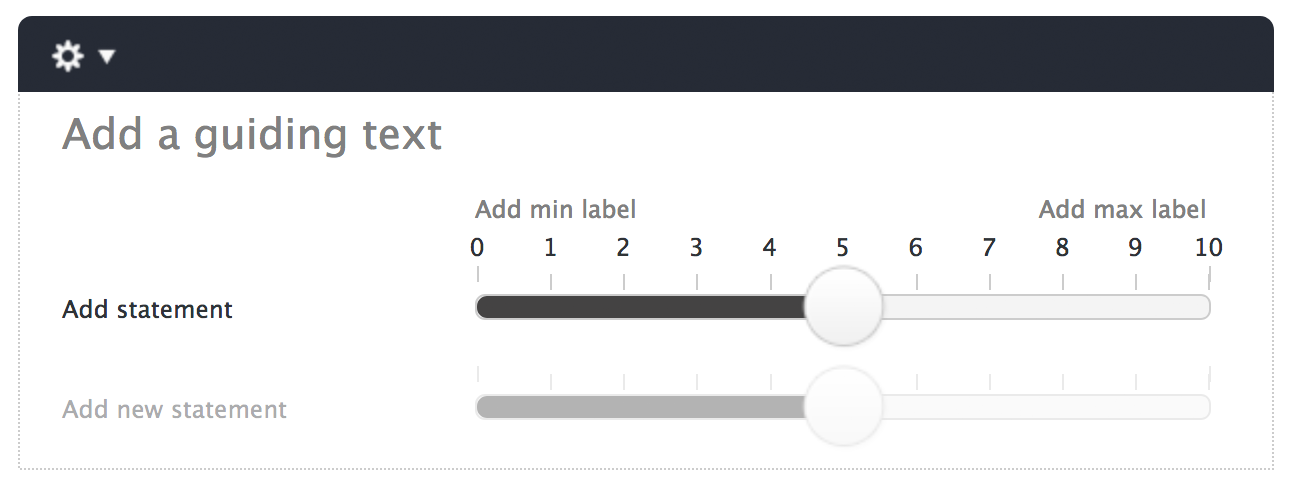
Slider element allows you to create scales in which one or more statements are asked using the same response scale.
If there are multiple statements in the element the averages of the statements can be seen in the same graph in the result space. The results of the sliders are shown in the same form as the results of the scale element.
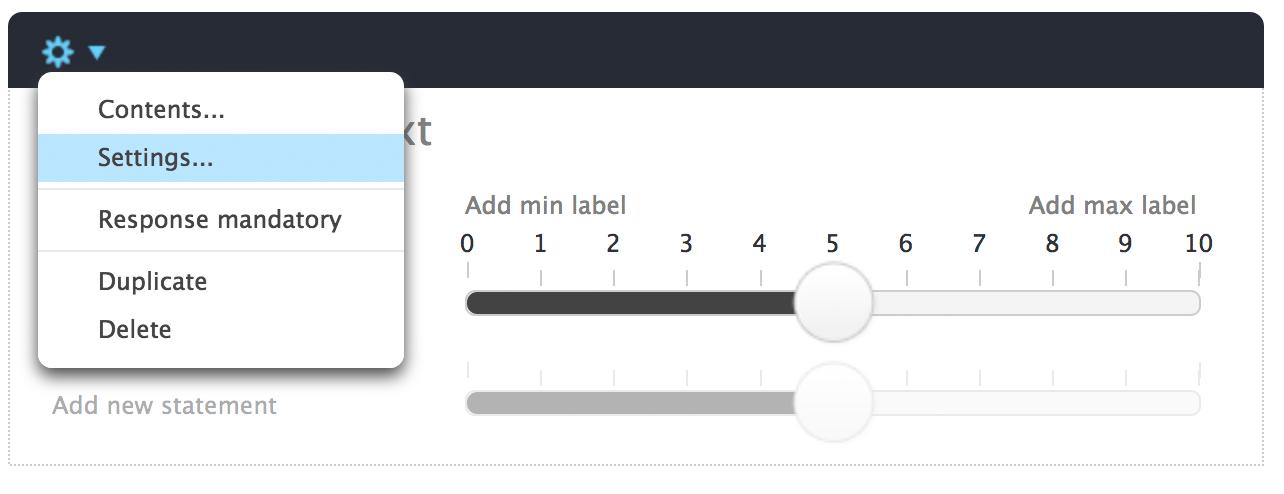
The default scale of the slider can be adjusted from the 'Settings' section of the gear menu:
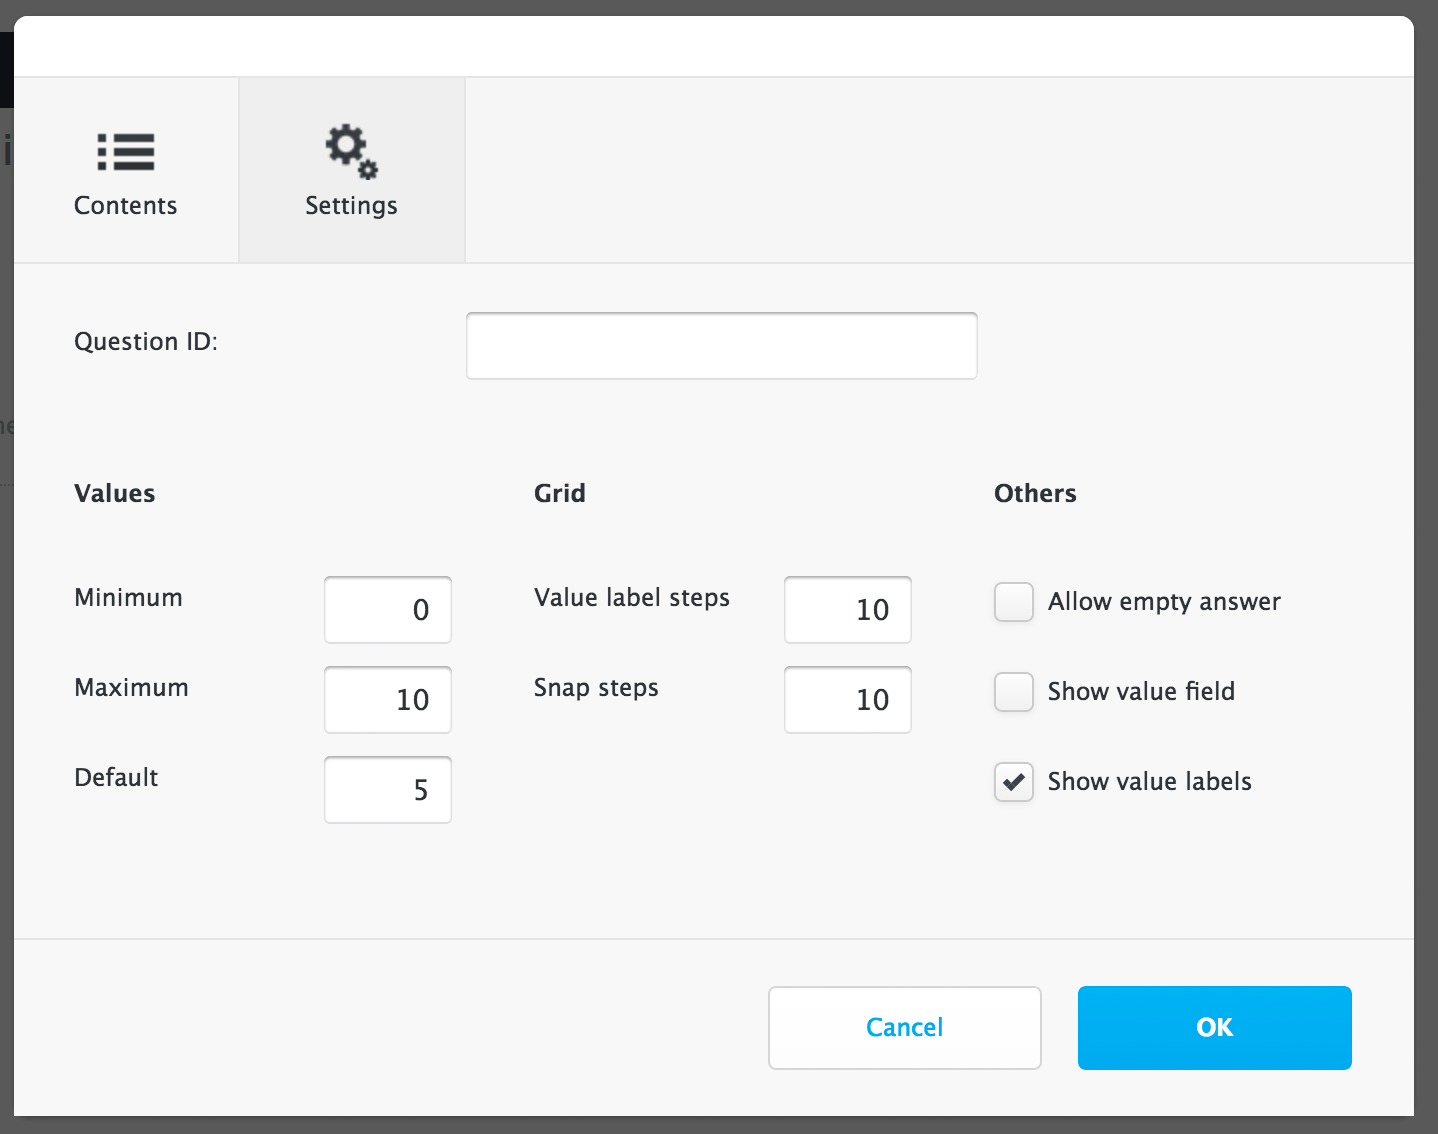
In the Settings window, you can define the following parts:
Values:
- The minimum value of the scale
- The maximum value of the scale
- The default value of the scale selector
Grid:
- The number of value label steps shows in how many parts the interval between the scale’s minimum and maximum values is displayed
- The number of snap steps defines how dense the step spacing is in the slider. Snap steps are calculated based on how many spaces there are between the min and max numbers: 0 to 10 has 10 snap steps, while 1 to 10 has 9 snap steps. To get 0.5 steps in the set value range double the snap steps number.
Others:
- 'Allow empty answer' gives the respondent the opportunity to leave the statement in question unanswered, even if the statements would have been set mandatory to respond to
- 'Show value in field' shows respondent the chosen value next to slider
- 'Show value labels' shows value labels above the slider
You can also change the handle of a slider
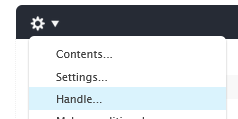
It is possible to use either shapes found on our service or you can add your own images.
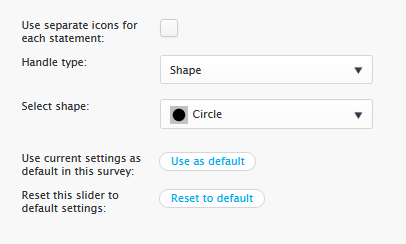
Shapes:
Use separate icons for each statement: You can define if you want for all the statements of this slider to use the same shape or different ones
Handle type: You can select if you want to use a Shape or an Image
Select shape: You can choose from the list of available shapes which you want to use
Use current settings as default in this survey: If you want to use the same settings for all sliders in your surveys, you can choose this after you've finished editing the slider handle.
Reset this slider to default settings: Resets to current defaults (so if the default options have been changed from circle shape, then it will apply the new defaults)
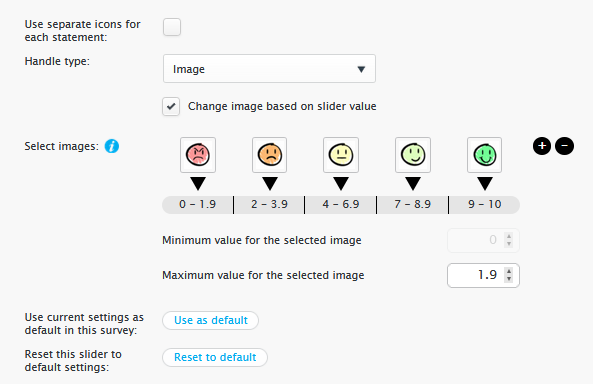
Images:
Use separate icons for each statement: You can define if you want the same image shown on each slider statement, or if you want to add different images for each
Handle type: You can select if you want to use a Shape or an Image
Change image based on slider value: You can define if you want to show different images on different slider values
Select images: You can set the amount of pictures wanted and the values where you want to show them to the respondent. Plus- and Minus-buttons on the right allow you to add or remove images.
- Click on an image to change it
- Click on the scale to change the values for each image
Use current settings as default in this survey: If you want to use the same settings for all sliders in your surveys, you can choose this after you've finished editing the slider handle.
Reset this slider to default settings: Resets to current defaults (so if the default options have been changed from circle shape, then it will apply the new defaults)
Tips & tricks
- If a large step interval is defined for a large slider scale, each step is shown as its own value point in the result graph. For example, if the step interval is set as 100 in a 0-100 scale, 100 value points will be shown in the graph X-axis. This may make interpretation of the result more difficult. In such cases, it is wise to use smaller step & value ranges.
- Make sure you have configured snap steps correctly. Put on the setting 'Show value field' and test the scale in the Preview to make sure you get correct values.